
After weeks of sideways grinding between roughly $65,000 and $75,000 through March and early April, Bitcoin has finally given traders a reason to pay attention again. BTC pushed decisively above the $78,000 handle in overnight trading, changing the character of the market from a drifting, range-bound tape into something that actually looks like an early-stage breakout.
The move isn’t happening in a vacuum. Risk appetite has improved after the White House extended its ceasefire with Iran, Nasdaq futures are up roughly 0.65% pre-market, and equity indices are catching a bid alongside crypto. But the more interesting story, and the one we want to focus on in this piece, is what’s happening on the Bitcoin chart itself and underneath the hood on-chain, because those two signals are now pointing in the same direction for the first time in weeks.
This is our in-house read of where BTC stands, what levels actually matter, and where we think the price is going from here. We’ll lay out both the bull case and the things that would invalidate it, and we’ll give you clear upside and downside targets so you can frame your own trade plan around them.
Where Bitcoin Stands Right Now
At the time of writing, BTC is trading in the high $78,000s, pushing into the $78,900 area intraday. That matters for a simple structural reason: the choppy $65K–$75K range that defined the last six weeks has been broken to the upside, and the market is now trying to establish new accepted value above the old ceiling rather than below it.
Three things have visibly shifted in the last 24 hours:
First, value has migrated higher. The daily point of control, which is essentially the price where the most volume transacted, has lifted from roughly $75,750 up to $78,250. The 4-hour point of control has followed it up to the same zone. When accepted value moves up alongside price, it tells us buyers aren’t just poking at resistance; they’re trying to build a new floor one level higher.
Second, the 100-day moving average has been reclaimed. This is the same line that capped Bitcoin’s bounce back in January and eventually led to the slide toward $60,000. Getting back above it, and starting to trade away from it, flips that line from resistance into potential support. The next major moving-average reference sits at the 200-day around $85,900, which is where we’d expect trend-followers to start getting more actively involved if the move extends.
Third, supporting this breakout is the Moving Average Convergence Divergence (MACD), which has just crossed into bullish territory on the daily chart. The MACD line has pulled away from the signal line, and the histogram is printing expanding green bars, suggesting that the current buying pressure has significant “velocity” behind it rather than being a low-volume fluke.
The On-Chain Backdrop Is Doing Real Work Here
Price action alone isn’t why we’re treating this breakout more seriously than the ones in February and March. The supply picture underneath it has genuinely tightened.
Bitcoin balances sitting on centralized exchanges have dropped to roughly 2.67 million BTC, a multi-year low. Said plainly, there is less Bitcoin immediately available to sell than there has been in years. Long-term holders are continuing to accumulate, liquidity on order books is thinner, and that combination is exactly what produces sharper upside moves once demand shows up.
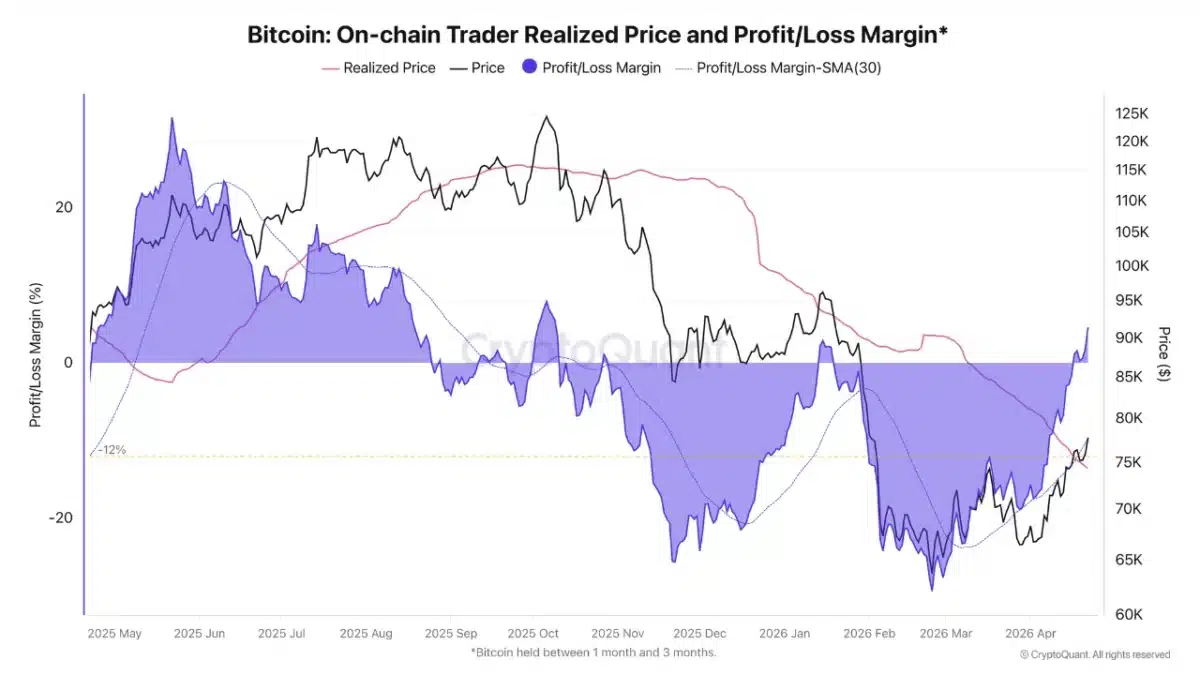
Crucially, this rally has finally pushed Bitcoin back above the $74,300 mark—the average “cost basis” for on-chain traders. This cohort, typically holding for one to three months, has been underwater for nearly a quarter. Reclaiming this level flips their aggregate position back into a ~4.8% profit margin, effectively removing the “break-even” sell pressure that often caps recoveries.
This is the supply-shock setup that crypto analysts have been talking about in the abstract for months. It rarely matters until a catalyst arrives. The Iran ceasefire extension and the rotation back into risk assets may be that catalyst.
The caveat, and it’s a real one, is that options positioning on Deribit still shows a premium on Bitcoin puts, meaning larger players are still paying up for downside protection. That’s a hedging signal, not necessarily a directional one, but it tells you institutional desks aren’t yet convinced this move is clean. They’re participating in the upside while insuring the downside, which is sensible and also means the rally could get tested before it extends.
The Levels That Actually Matter
Not every price on the chart deserves equal weight. The zones we care about are the ones where multiple timeframes, prior reactions, and volume profile all point to the same area.
$78,250 is the single most important level right now. Both the daily and the 4-hour point of control have settled here, which means this is where the market is currently trying to define “fair value.” A hold above this line keeps the breakout thesis alive. A slip below it turns the move into a failed test.
$78,545 sits just above it as the recent overhead gate. Clearing and holding through $78,545 is what takes this from “interesting push” to “confirmed breakout.”
$77,750 is the first warning line on the downside. A move back below it would tell us bulls couldn’t defend the reclaim.
$76,750 is the more serious short-term failure level. Losing this opens the door back down to $75,750, $75,250, and potentially $74,250 on a deeper flush.
One thing worth stressing: crypto often prints intrabar fakeouts in both directions. A wick above $78,545 that immediately gets rejected is not the same as a 4-hour close above it. Close-based confirmation is what matters. A live candle shows attempt; a completed candle shows evidence.
Where is Bitcoin going?
Putting the technicals, the on-chain setup, and the macro backdrop together, here is how we’re framing Bitcoin from here.
Primary bullish target: $85,000–$86,000. If BTC can confirm a clean 4-hour and daily close above $78,545 and start using the $78,250 zone as support on any pullback, the path of least resistance opens up toward the $80,000 psychological level first, and then toward the 200-day moving average around $85,900. That’s our near-term upside target, and we’d expect the first meaningful resistance along the way to come in around $80,000 (round-number selling) and then $83,000 (a historical cost-basis cluster that Schwab research has flagged as a likely supply zone).
Extended bullish target: $92,000. If Bitcoin clears the 200-day and the supply-shortage dynamic on exchanges keeps tightening, we see room for an extension into the low $90,000s before the market needs a meaningful rest. This is the scenario where momentum buyers, trend-followers, and ETF flows all start reinforcing each other.
Bearish invalidation: $76,750. If BTC loses this level on a closing basis, we’d step aside on the long thesis. Below there, the path reopens toward $75,750 and then $74,250, and the breakout gets re-classified as a failed test of range highs.
Our base case: We lean bullish here, but with measured conviction. The combination of reclaimed 100-day, rising value area, multi-year low exchange balances, and improving risk sentiment is a genuinely constructive setup. The persistent put premium and the fact that the current candles are still open are why we’re not calling this a fully confirmed breakout yet.
If we had to assign probabilities to the next two to three weeks: roughly 60% odds of reaching the $85K–$86K zone, 25% odds of a deeper rejection back into the old range, and 15% odds of the extended move toward $92K if momentum compounds.
What Prediction Markets Are Pricing In
One of the more useful cross-checks for any technical price target is what real money is betting on elsewhere. Polymarket’s “What price will Bitcoin hit in April?” market — with roughly eight days left on the clock at the time of writing — gives us a clean sentiment read that we can line up against our own targets.
Here’s what traders are pricing:
A few things jump out.
The market is strongly positioned for $80,000 to print. The “hits $80K” contract is trading at 76 cents, up from around 13% before today’s move, and it’s by far the highest-volume line on the board at $5.3 million. Traders aren’t just expecting the breakout to hold — they’re expecting BTC to keep going and tag the psychological round number within the week. That aligns closely with the first leg of our own target range.
$85,000 is where conviction thins out. The 17% implied probability on “hits $85K” is notable because it represents the crowd essentially saying “we believe $80K is coming, but getting to the 200-day moving average in eight days is a stretch.” Our analysis is more optimistic on this level over a two-to-three-week window, but for an April deadline specifically, the skepticism is reasonable — that’s a lot of ground to cover in limited time.
$90,000 is priced as a tail event. At 4%, prediction markets are essentially saying a run to $90K by end of April would require something to go genuinely right, not just technically right. That tracks with our extended target scenario, which we had at 15% odds over a longer horizon.
Downside tail is being priced as unlikely but not ignored. The combined probability of BTC trading at $70K or below by end of April sits around 17%. That’s consistent with a market that has repositioned bullish but isn’t completely dismissing the possibility that the breakout fails. It also lines up roughly with our own 25% odds of a deeper rejection back into the old range.
The takeaway: prediction-market pricing is broadly confirming the structural read from the chart. Real money agrees that $80K is the next magnet and agrees that the serious upside targets need time the April contract doesn’t give them. For longer-horizon positioning, this actually makes our $85K–$86K target look underpriced by the crowd rather than overpriced — which is often where the better risk/reward lives.
What to Watch Next
A few things will decide which scenario plays out:
The daily close tonight is the first real tell. A close above $78,545 is what we want to see.
Oil prices matter more than usual right now. WTI is trading around $87–$90 after bouncing from Friday’s $78 low. If crude rolls back over, it removes a major overhang for risk assets and gives BTC more room to run. If it spikes on Middle East headlines, expect crypto to wobble.
ETF flows and exchange balances. If the exchange-balance trend keeps declining while ETFs see net inflows, the supply-shock thesis gets stronger and any dip becomes a buyable event rather than a trend-change.
Bottom Line
Bitcoin has moved from “repairing under resistance” to “live breakout attempt” in about 24 hours. The technical picture, the on-chain picture, and the macro backdrop have aligned more cleanly than they have in weeks. We think the path of least resistance points toward $85,000–$86,000 as a primary target, with $92,000 as an extended scenario if momentum holds. The level that decides which way this breaks is $78,250 on the way up and $76,750 on the way down.
For traders, the setup is straightforward: use $78,250 as your line in the sand, size accordingly, and let the close confirm what the intraday wicks are suggesting. For longer-term buyers who have been waiting for an entry, we think the risk/reward is tilting back in favor of accumulation, though it’s worth remembering Bitcoin is now 24 months into the post-halving cycle and late-cycle volatility historically runs higher in both directions.
Also Read: Bitcoin Hits 11-Week High Above $78,000 as Trump Extends Iran Ceasefire


